Results type Graph
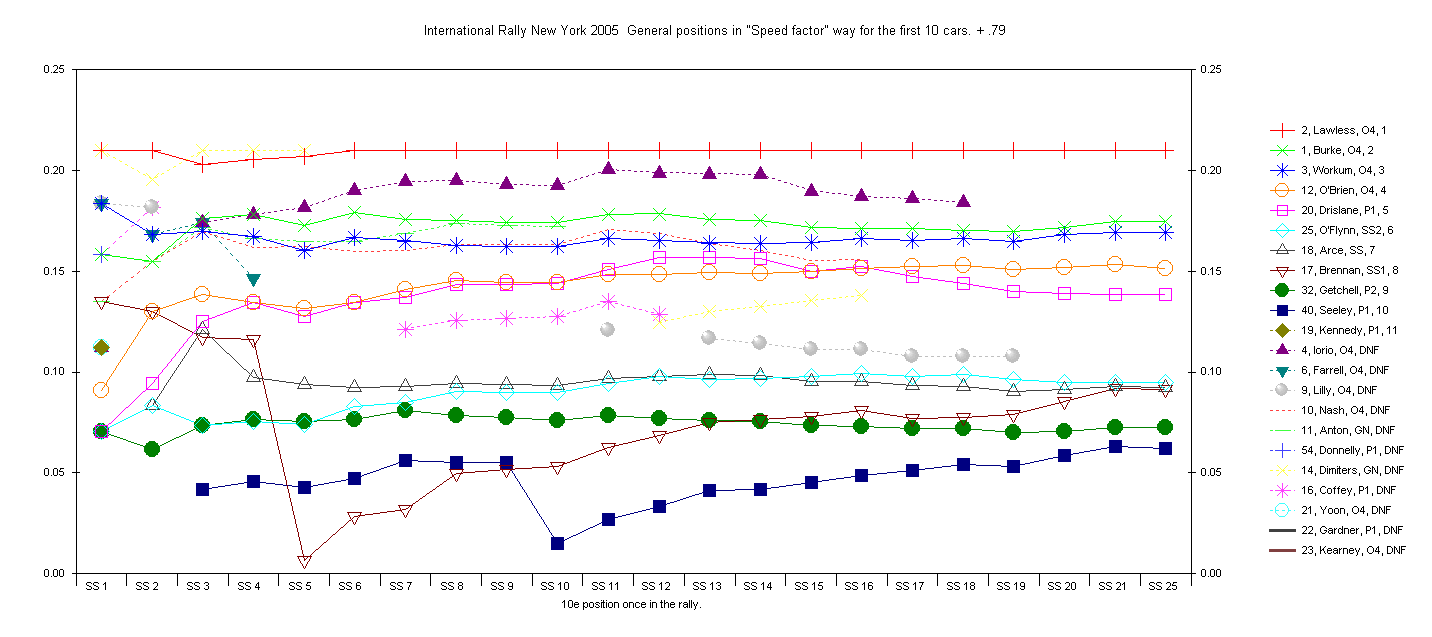
Excel Graph on position change in the Rallye. It show when a driver try to catch-up or slowing-down. Here you can see that Iorio was amost catching-up at stage 11 but he was not able to keep-up.

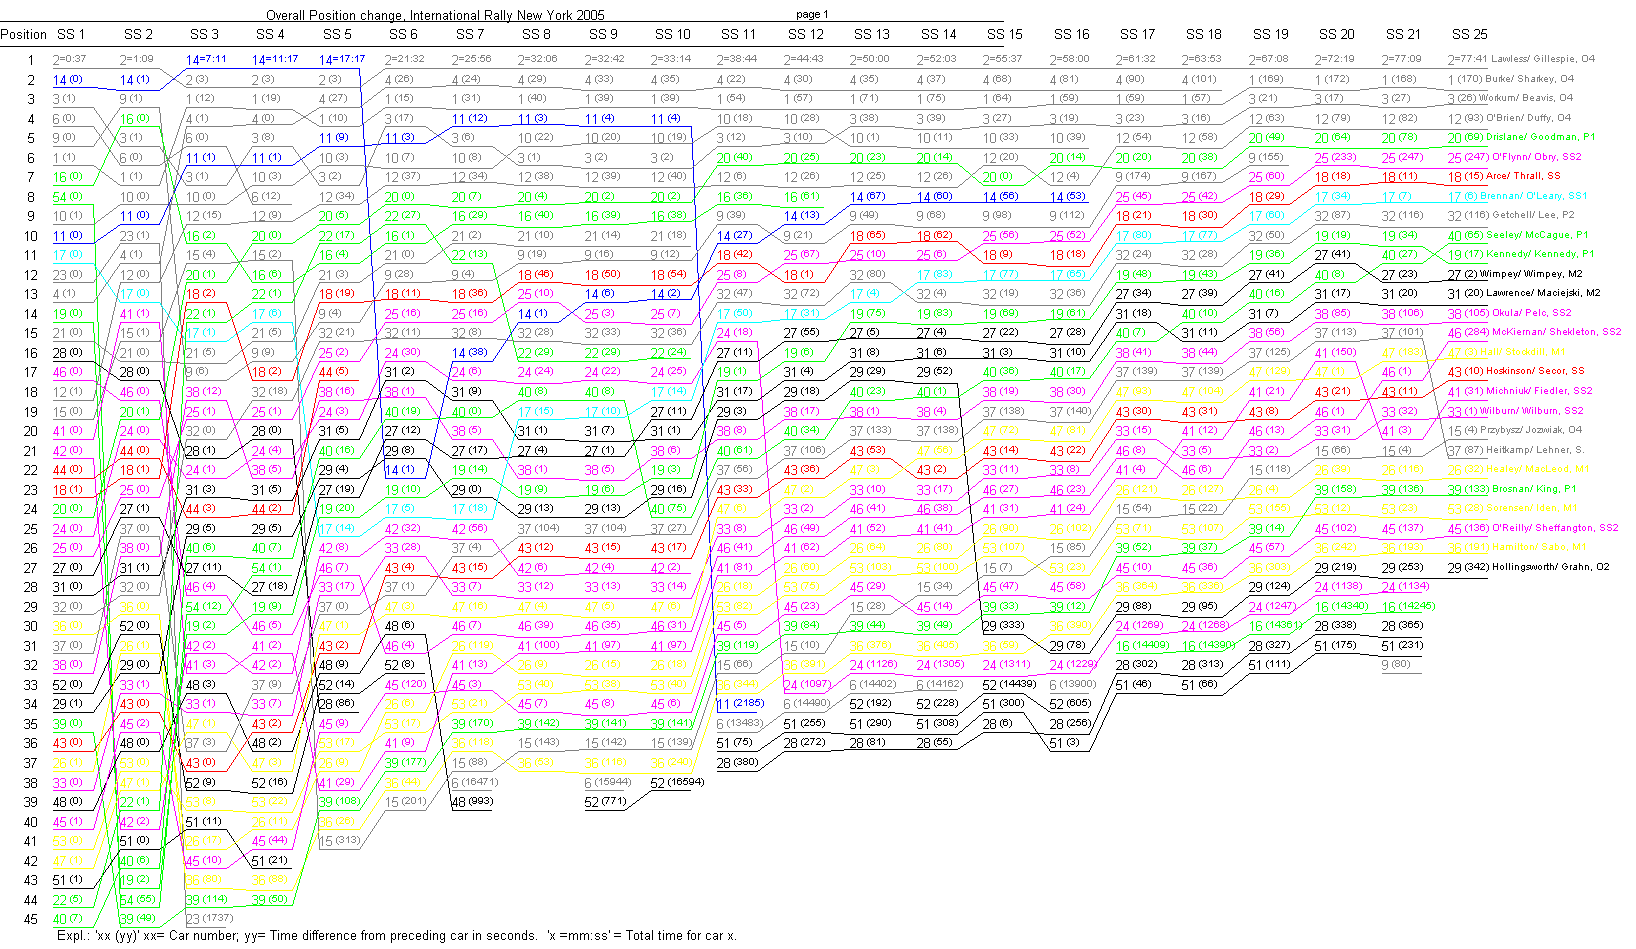
Graph
on position changes in a rally. The gap between a car and the car ahead is
shown in seconds (in brackets). The line moves up or down when a car is
gaining or losing time vs the car ahead.

Graph on position changes. The gap from the first car is shown in percentage.

You can look at my Results page to see some samples.